
Ever wonder how to create a customized and interactive geographical map using Python (for free)?
You’ve come to the right place!
This is a simple tutorial on how to set up MapBox and Plotly to visualise map data.
At the end of this tutorial, you will be creating your first map that looks like this 👇

Notes
This article is written based on my coding experience in Google Collab, so there might be some part which is irrelevant to those using Python in your local computer.
I am a complete beginner in geo visualisation, this guide is intended for those are are looking for an easy way to start visualise map in the data projects. Appreciate any feedback if any :)
Pre-requisites
- MapBox Account and Access Token
- Python Libraries: Pandas & Plotly
- Google Account/ Google Collab
💡 Don’t have the pre-requisites listed above? Don’t worry! We’ll cover everything to help you get them.
» Outline
Outline is provided in case you wish to revisit certain topics.
- 1.1 Register for MapBox Account
- 1.2 Get your Public Token
- 1.3 Save your Token
- 1.4 Read your Token File to Python Environment
Part 2: Python Libraries Installation in Google Collab
Part 1: MapBox Setup

Mapbox is a powerful tool to build interactive maps. According to Mapbox own words, “Mapbox is a location data platform that powers the maps and location services.”.
Some popular apps like Snapchat, Lonely Planet, and even Business Intelligence Tool like Tableau are also utilising mapbox technology to empower more analyst and developer to visualise geospatial data at ease!
To use Mapbox mapping services, we need to register for an account at mapbox.com.
Rest assured no cost would be incurred, because no credit card required! * YAY *
Just to make it clear, it’s not a completely free product. Mapbox do charge if your usage exceed certain threshold.
But as a data analyst that just need an interactive map to visualise geo data, it’s unlikely that you’ll exceed that limit.
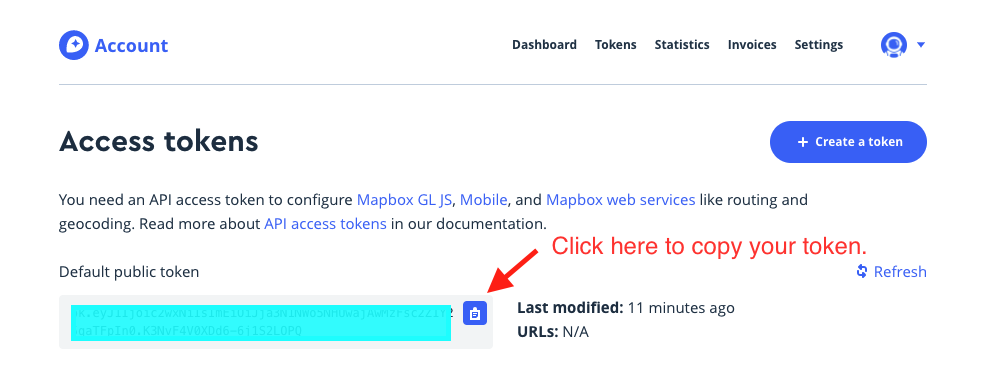
Step 2: Get your Public Token
Once you completed the registration process, you need to login to your account and go to this page to get your access token.
Step 3: Save your Token
Now we need to save the token in a text file (with .txt extension) and upload it to Google Drive. This additional step is highly recommended, but not compulsory.
This way of accessing the token makes sure that you don’t accidentally share your access token in your source code, especially if you are working with others collaboratively on the same project.
Step 4: Read the Token to Python Environment
We are all set now! Let’s create a new noteboook in Google Collab.
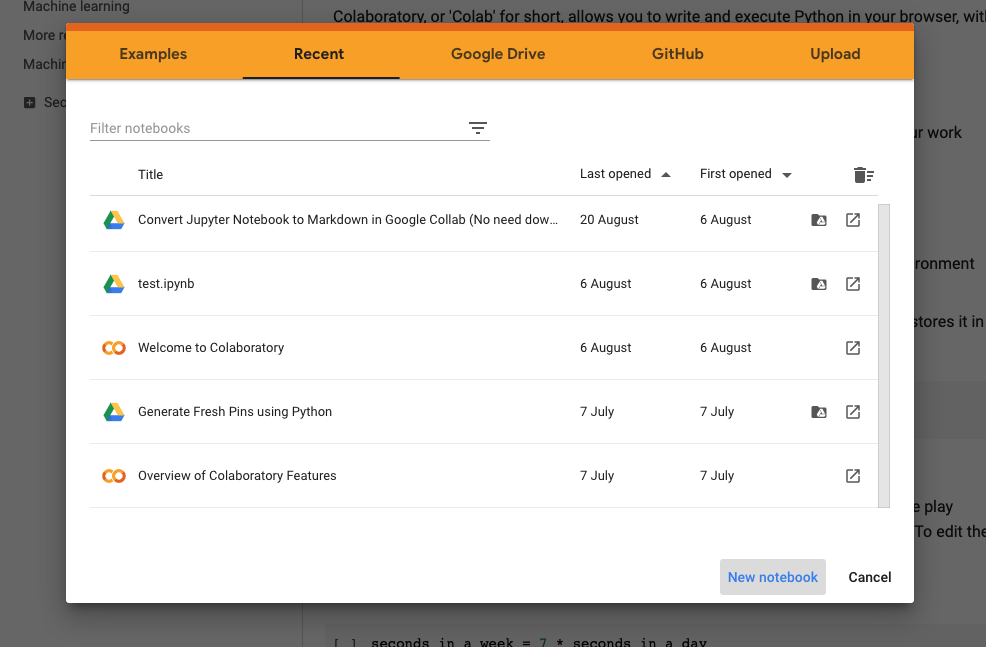
Next, we need to mount Google Drive to our notebook. Mounting Google Drive enable us to read files located in Google Drive directly without uploading to Colab workspace.
from google.colab import drive
drive.mount('/content/drive')
In short, you’ll need to click on the link shown in the terminal. Then, login to your Google Account to get the authorization code. Copy the code and paste in the input box in Notebook.
Why do we need to mount GDrive instead of uploading it directly to Colab?
If you upload the token file directly to Colab, your data would no longer be acessible when you disconnected. This simply means everytime you work on the project, you’d need to reimport the files or dataset again.
Now, get the file path of the token file you just uploaded and replace the placeholder below ( {enter your file path} ). If you not sure how to get it, read this article.
my_token = open("{enter your file path}").read()
Part 2: Python Libraries Installation in Google Colab
As mentioned earlier, we need 2 Python libraries:-
-
pandas
Pandas library is already pre-installed in Colab. So you don’t have to install it. We won’t be using this package in this tutorial, but we’ll need it in the next tutorial if you’d like to follow along.
-
plotly
Plotly Python library is an interactive, open-source plotting library that supports over 40 unique chart types covering a wide range of statistical, financial, geographic, scientific, and 3-dimensional use-cases.
To install in Google Collab, simply copy paste code below.
! pip install plotly==5.2.1
💡 We use disclaimer “!” to specify terminal command in Jupyter Notebook.*
Part 3: Your First Map with Plotly & MapBox
Simply run the code below to test if everything was set up correctly.
Here we are using sample dataset from the package to generate the graph.
import plotly.express as px
px.set_mapbox_access_token(my_token)
df = px.data.carshare()
fig = px.scatter_mapbox(df, lat="centroid_lat", lon="centroid_lon",
                        color="peak_hour", size="car_hours",
                        color_continuous_scale=px.colors.cyclical.IceFire,
                        size_max=15, zoom=10)
fig.show()
Congratulations! You should see this beautiful chart now 💖
Eager to learn more about application or use case that powered by Mapbox? Visit Mapbox Showcase!
Credit: Cover Photo by Tamas Tuzes-Katai - Unsplash